arcgis - 实现地图渲染, 人口GDP等历年信息,tiff 转换成 excel, 切换中文
访问量: 1639
安装:
http://www.bigemap.com/helps/doc2018011754.html
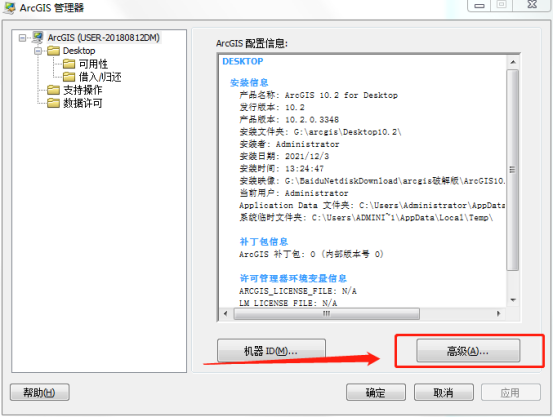
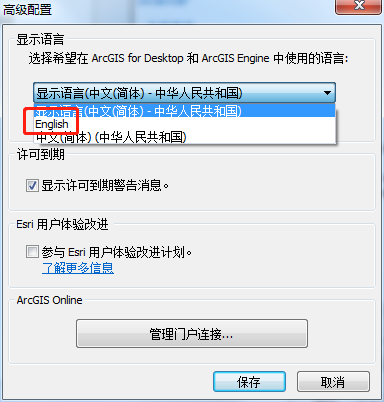
切换语言
https://support.esri.com/en/technical-article/000011102
arc gis admin ... -> 高级 -> 语言 即可
中文版实在用不了,需要英文版。
GIS中的坐标变换:
https://zhidao.baidu.com/question/374036197657996044.html?qbl=relate_question_6
打开方式:
直接打开tif 或者对应的 aux文件即可。
(https://gis.stackexchange.com/questions/127816/how-to-open-ovr-files-in-arcgis/395781#395781)
把 .tif 转换成excel的一度x 一度:完整版建议点击这个链接查看图文 详情
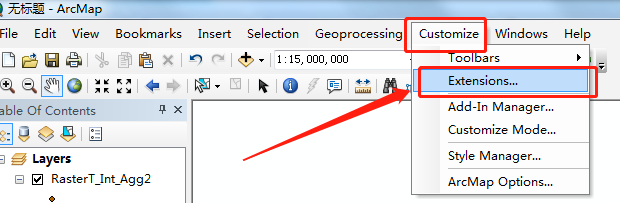
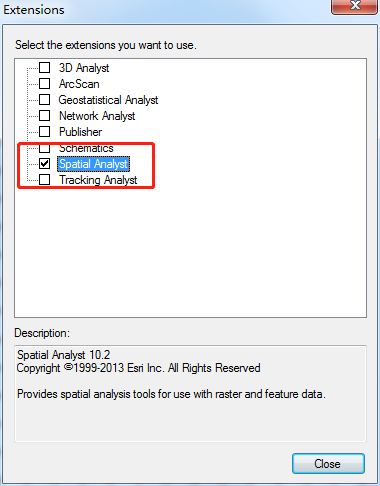
https://gis.stackexchange.com/questions/403468/how-to-convert-tiff-file-to-shapefile-then-convert-to-excel-csv-file-using-arcm0. 保证你的 spatial analysis tool 这个扩展是可用的。 ( https://support.esri.com/en/technical-article/000020013 )
打开arcmap -> customize -> extensions -> spatial analy .. 开启
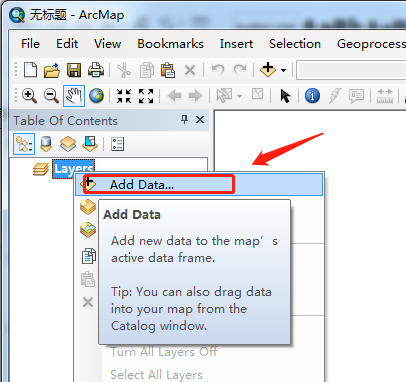
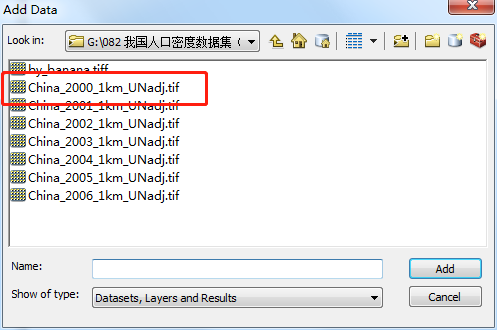
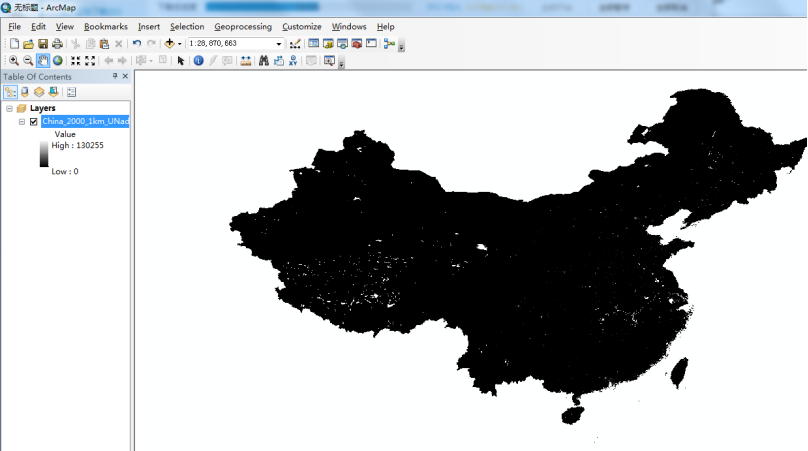
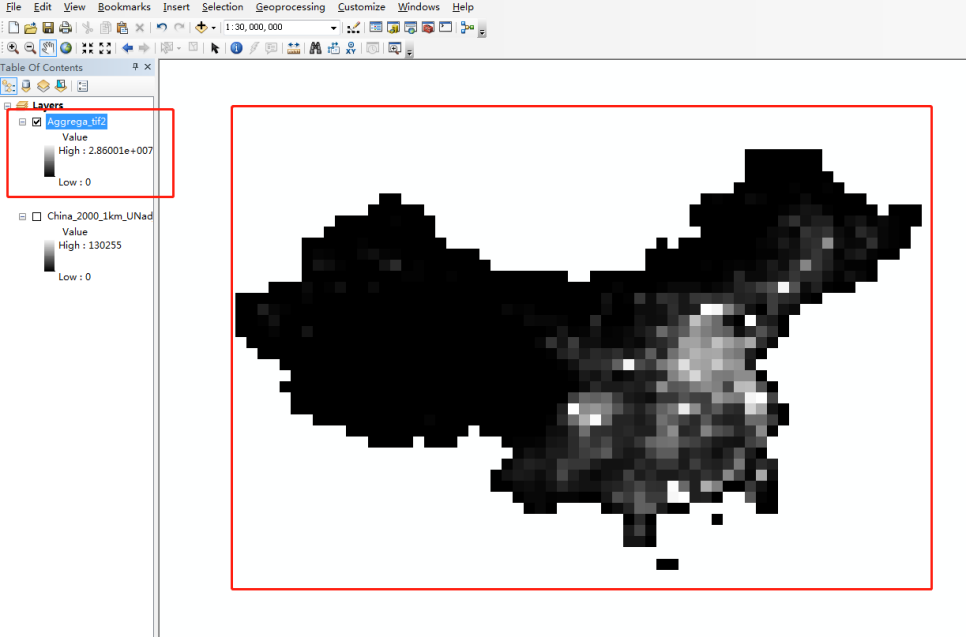
1. 打开对应的tif 文件( 打开arc map, layers -> add data -> 选择tiff 文件,就会看到图形已经出现了)
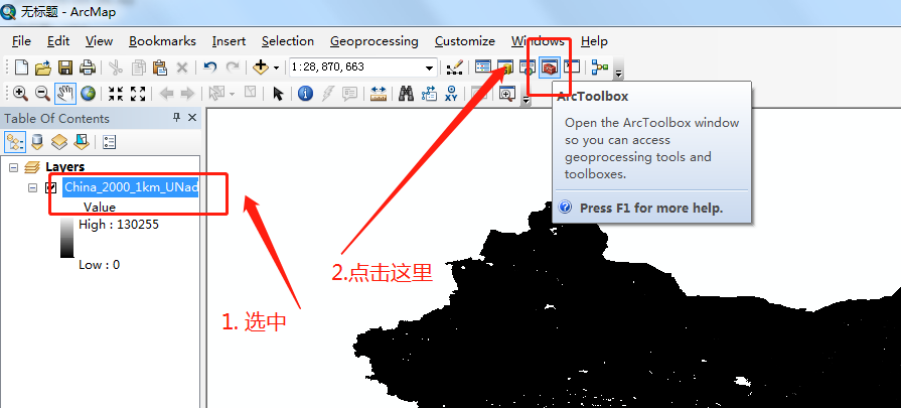
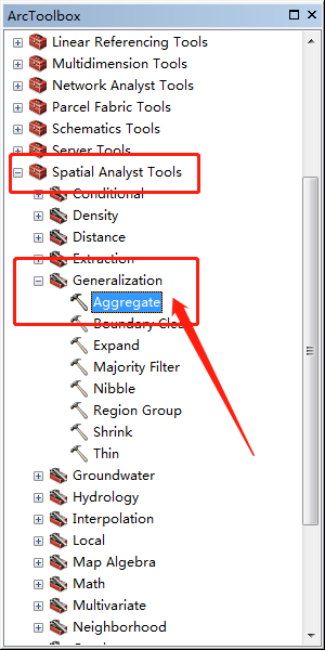
2. 点击打开的tif layer, 然后点击 arctoolbox -> spatial analyst tools -> generalization -> aggregate ,
3 选择好目标layer
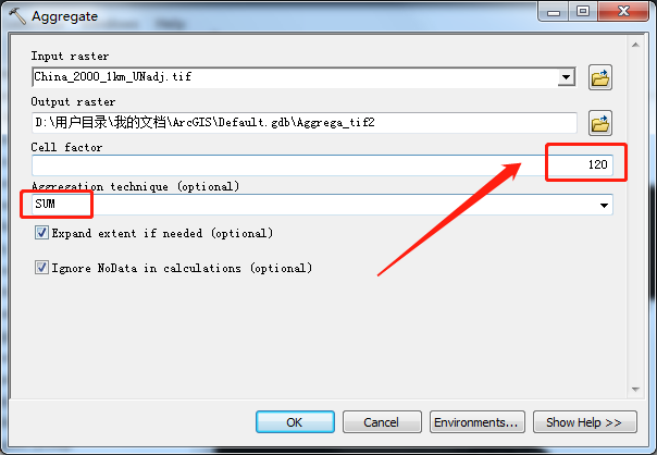
value那里填写120 ( 因为1度 / 0.008 .. = 120 ) , 这个 0.008 应该就是tiff 的最小的一个点的宽度, 一度的长度大约是120公里
4 得到一个新的 layer: aggrega_tif1
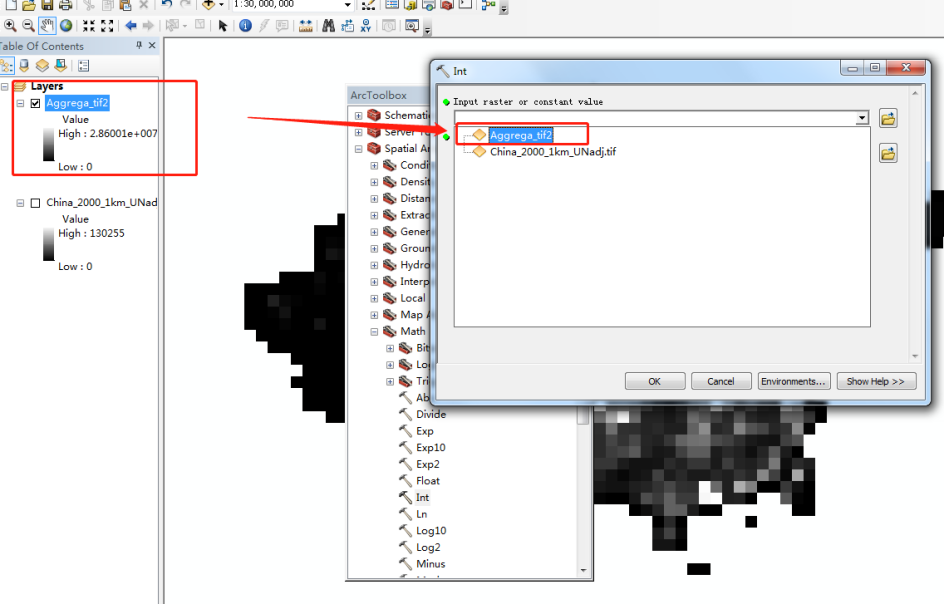
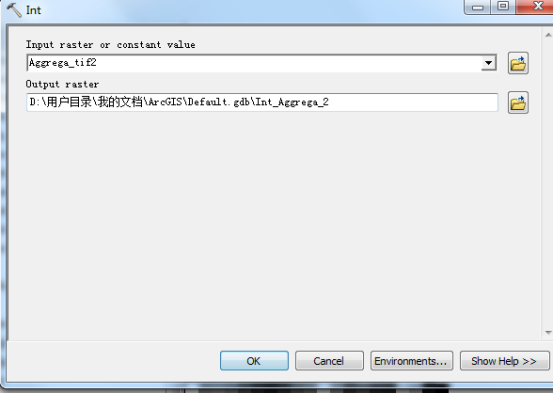
5 点击上面得到的layer: aggrega_tif1, 然后 arctoolbox -> spatial analyst tools -> math -> int,
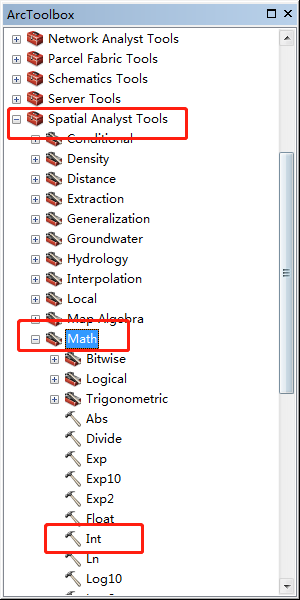
6 把当前layer 转换成整数
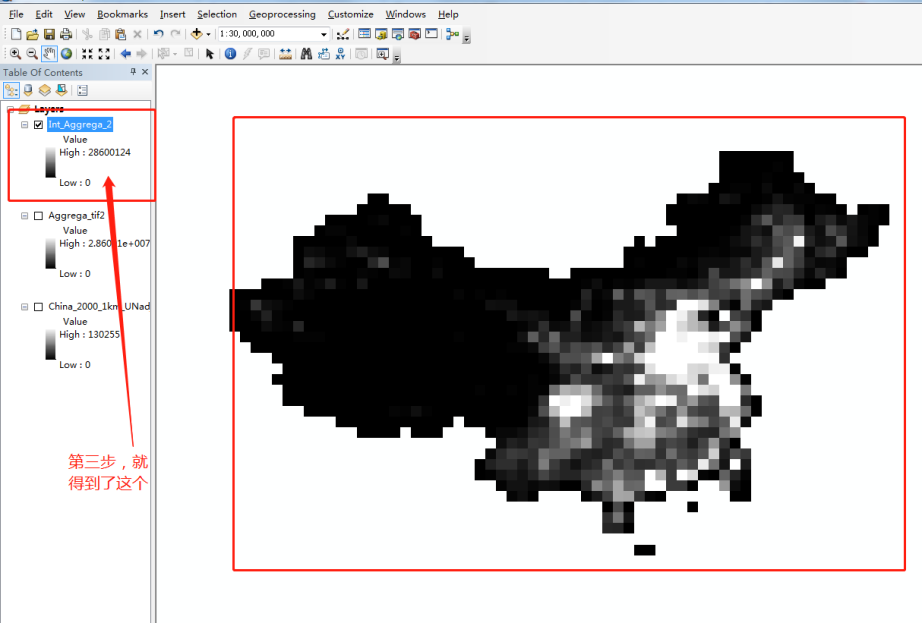
7. 点击上面得到的新layer inte_aggrega_tif1, 然后 arc tool box -> conversion tools -> from rasters -> raster to point ,
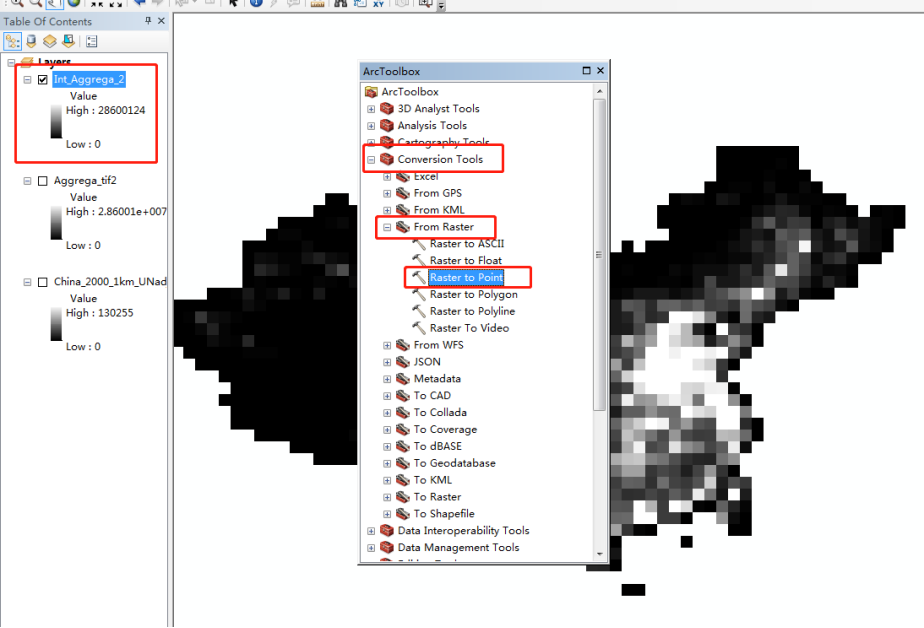
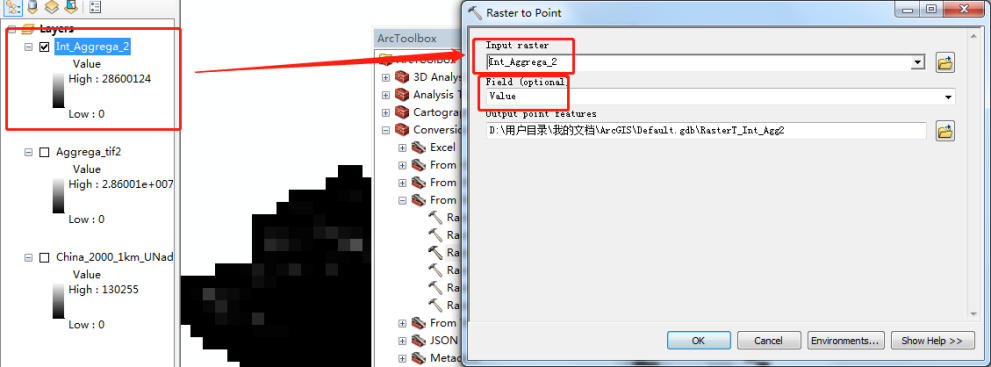
8得到一个新的layer ( 记得该窗口下的 field ( optional ) 要填写 value , 该value 就是 "value" )
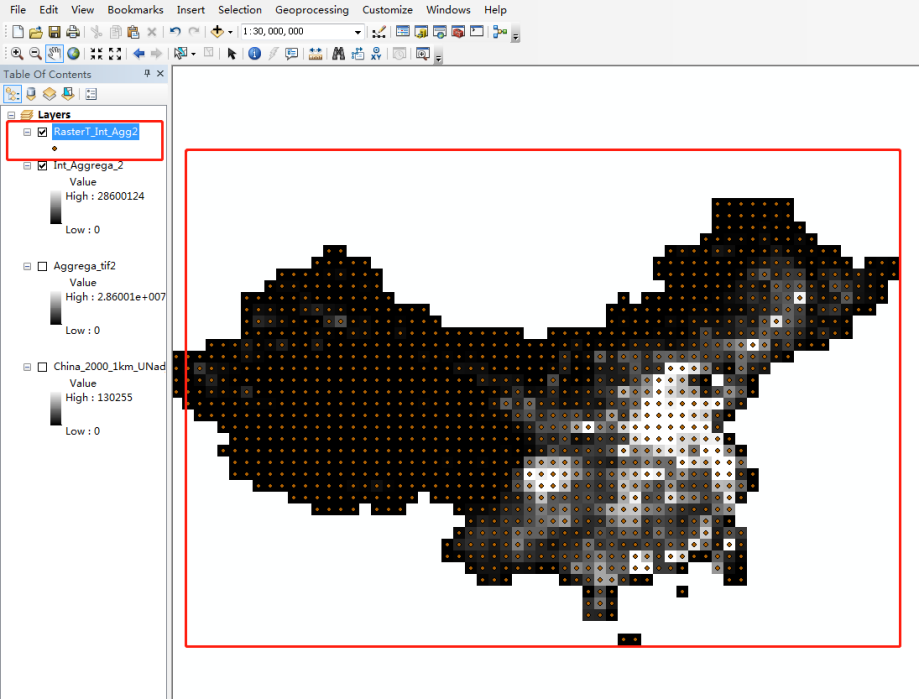
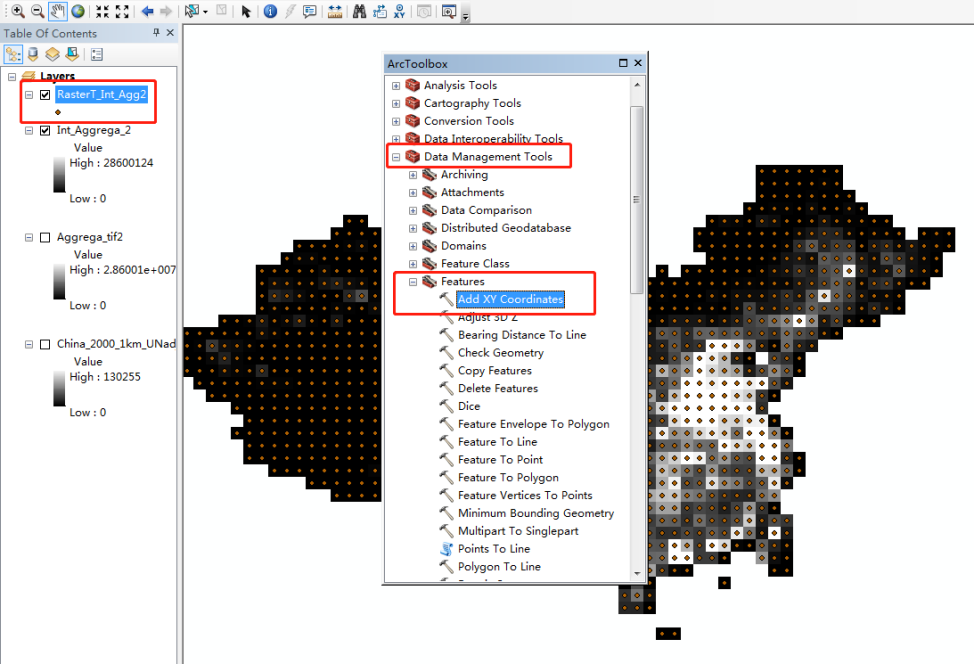
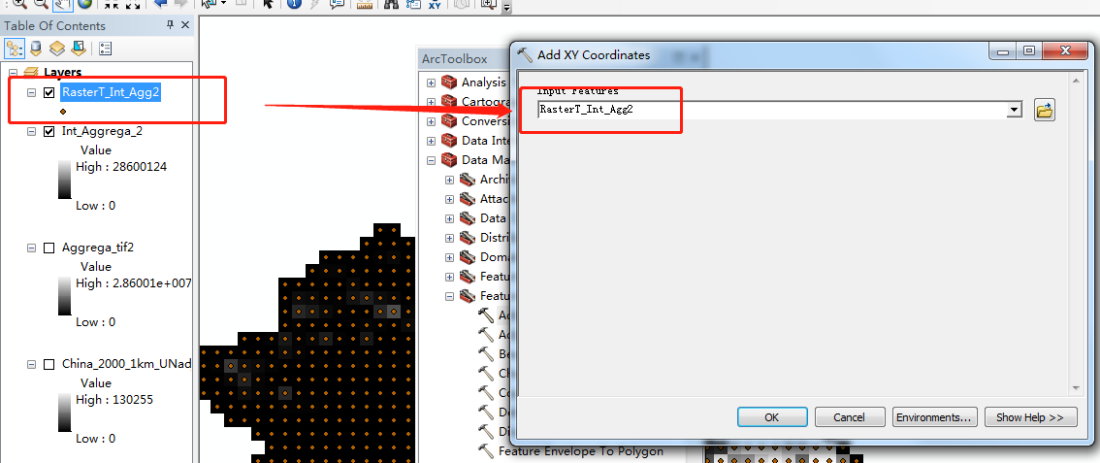
然后在该layer(鼠标点中的状态) arc tool box -> data management tools -> features -> add xy coordinates, 这些点就增加了xy 的坐标(经纬度)
9. 上面的新layer
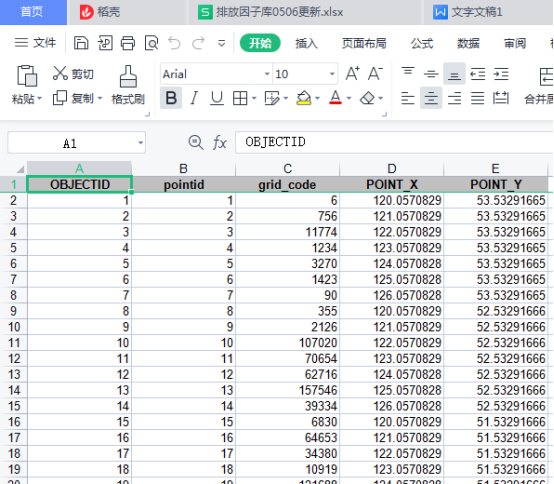
然后点击 arc tool box -> conversion tools -> excel -> table to excel,
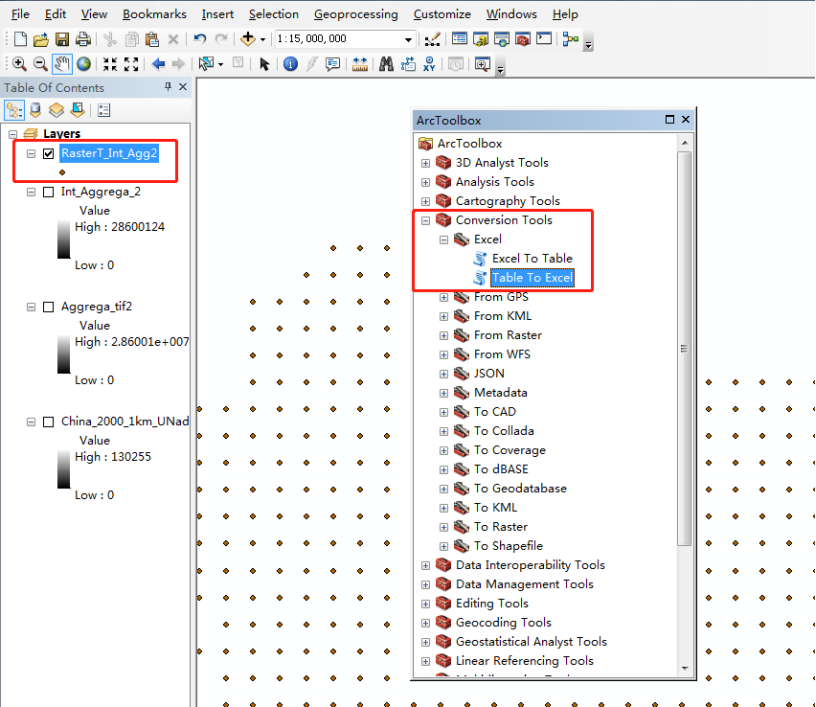
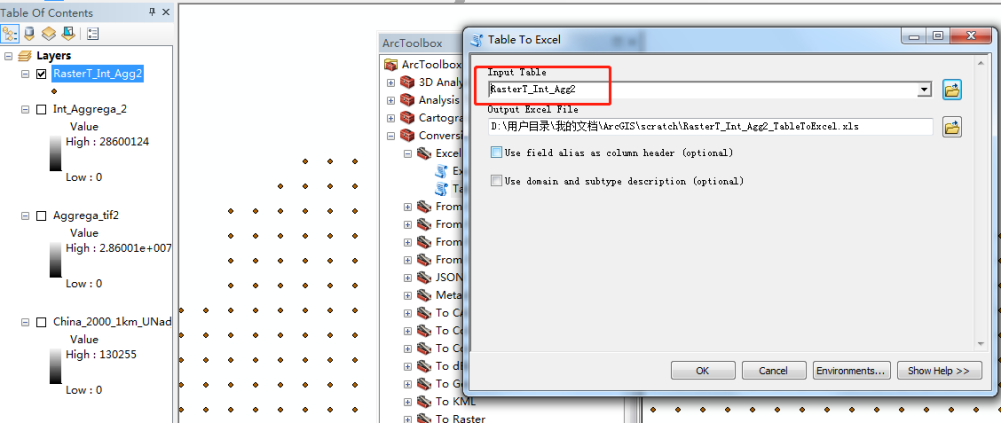
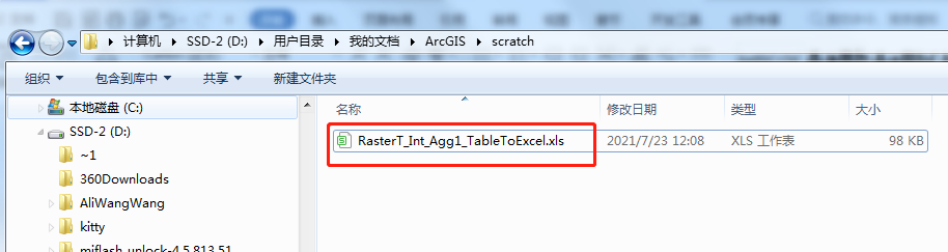
10. 就可以得到excel 了。